
Indian Advertising Spend, 2016 to 2025: Where the Money Went
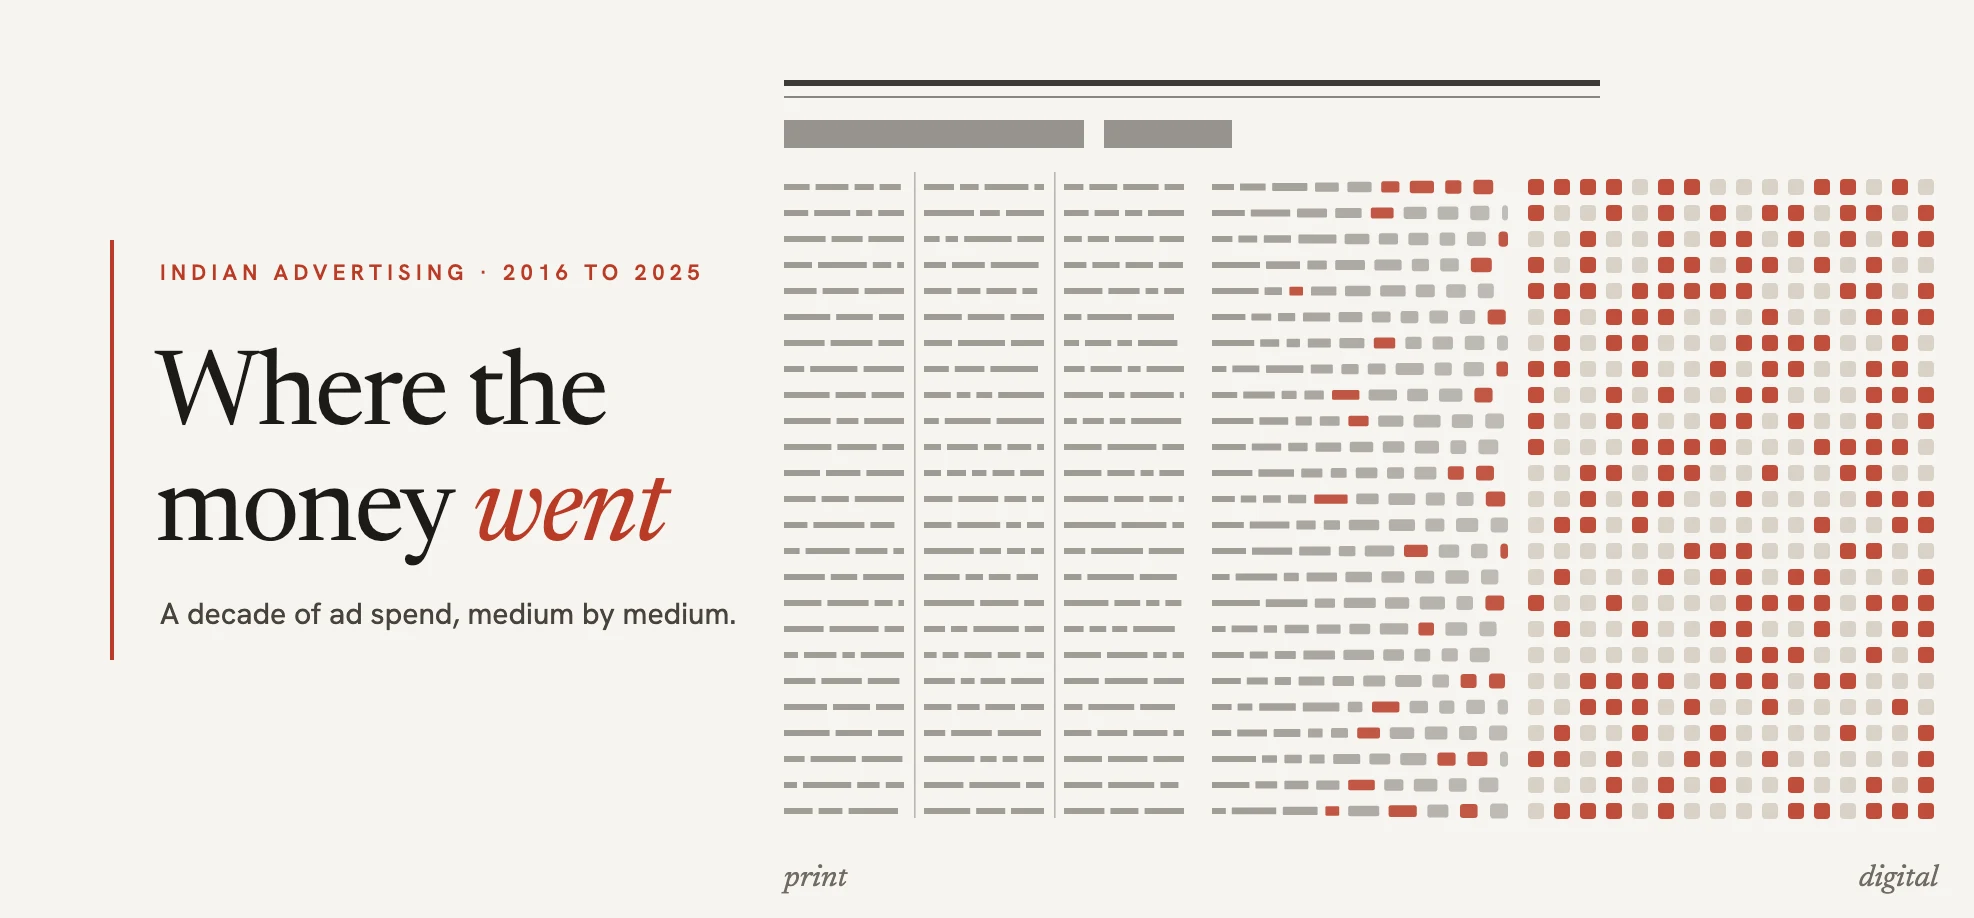
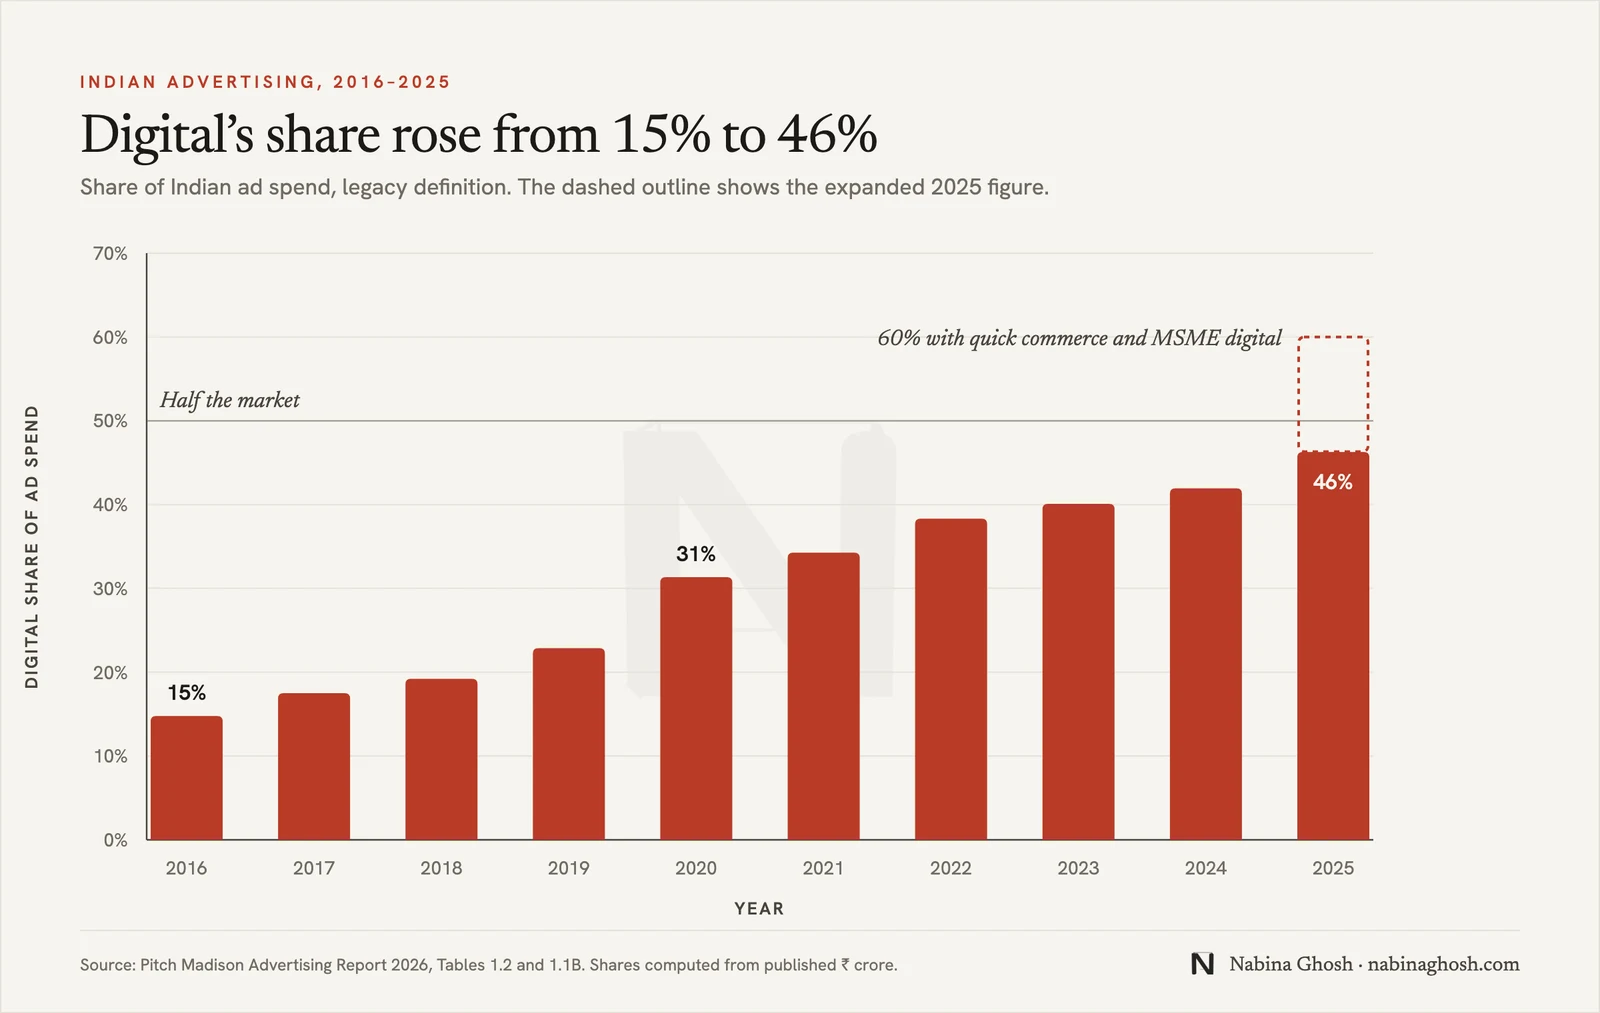
In 2016, digital media took 15% of the money spent on advertising in India. By 2025 it took 46%. Count quick commerce and small-business digital spending as well, and it was 60%.
If you work in advertising, you already know the broad story. Putting the published numbers side by side adds the detail. Traditional media actually lost very little. Much of the new money went into formats that were small, or did not exist, in 2016. And the two most quoted industry reports are far apart on how big the market is.
This piece sets out those numbers in one place, with every figure traced to its source. The method and sources are at the end.
The decade in five numbers
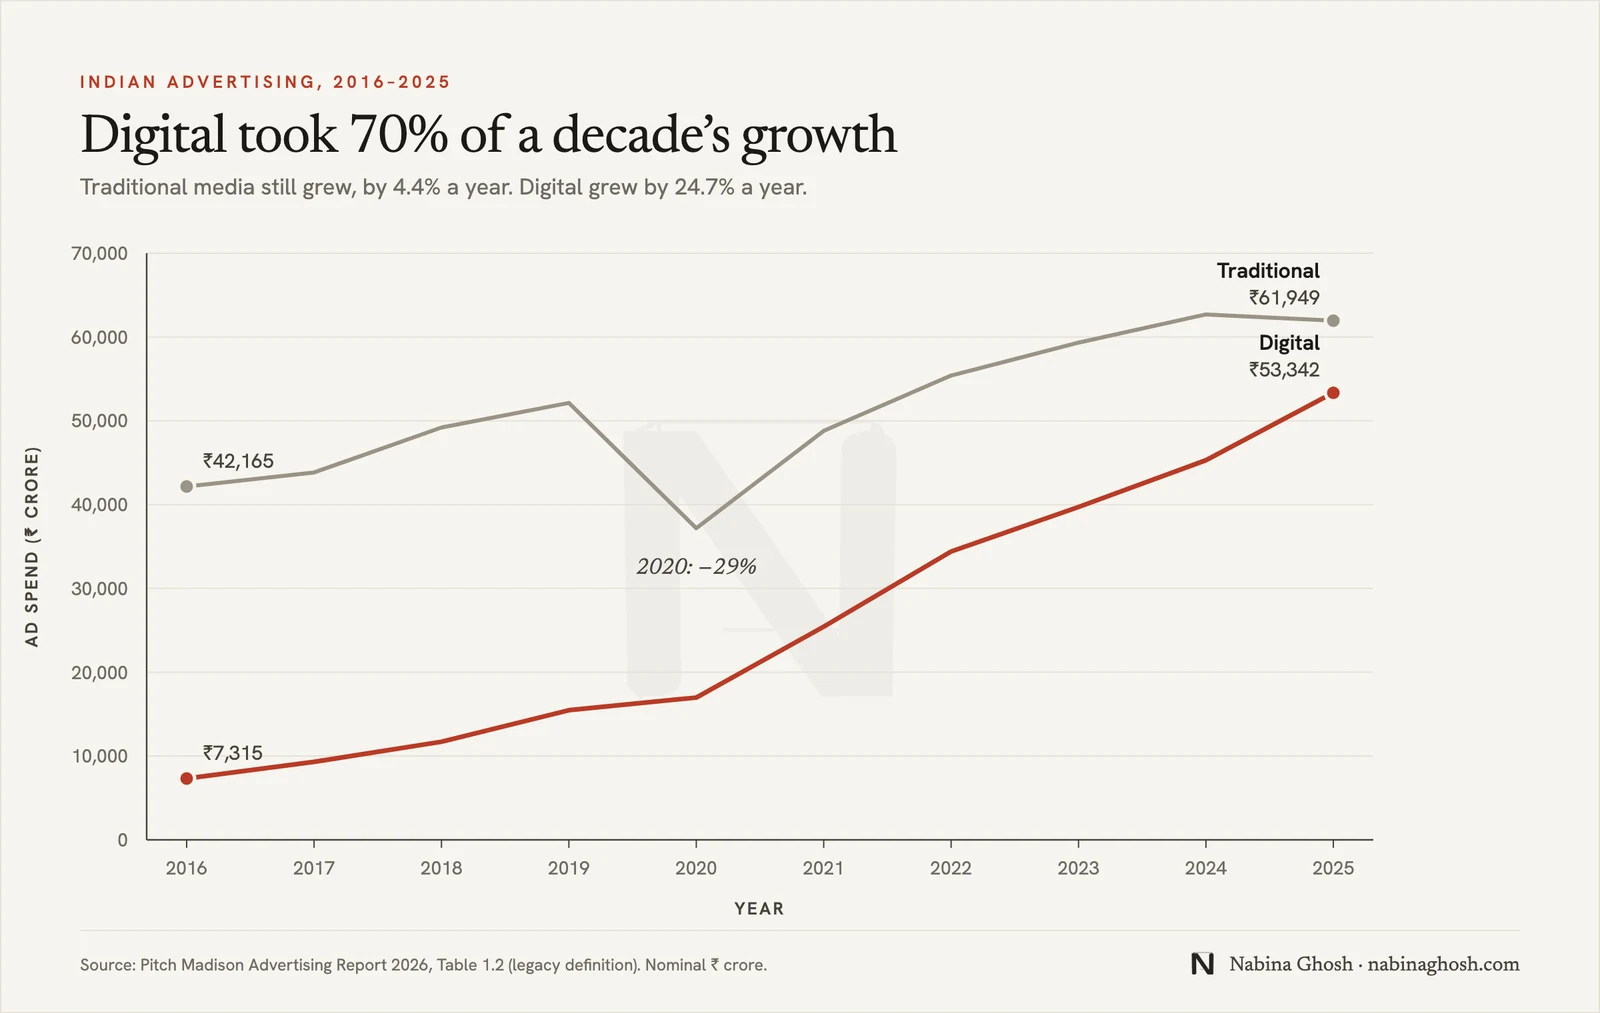
- 2.3 times. Indian advertising expenditure grew from ₹49,480 crore in 2016 to ₹1,15,291 crore in 2025, about 9.9% a year.
- 70%. Of the ₹65,811 crore the market added over the decade, digital accounted for ₹46,027 crore.
- 7.3 times. Digital grew from ₹7,315 crore to ₹53,342 crore, about 24.7% a year.
- 4.4% a year. Traditional media (television, print, radio, cinema and outdoor) grew from ₹42,165 crore to ₹61,949 crore. Slow, but growth.
- −1%. In 2025 traditional media shrank in absolute terms for the first time since the pandemic, by ₹739 crore.
All five come from the Pitch Madison Advertising Report 2026, Table 1.2, which uses the same definition for all ten years.
| Year | Traditional (₹ crore) | Digital (₹ crore) | Total (₹ crore) | Digital share |
|---|---|---|---|---|
| 2016 | 42,165 | 7,315 | 49,480 | 15% |
| 2017 | 43,835 | 9,303 | 53,138 | 18% |
| 2018 | 49,202 | 11,705 | 60,908 | 19% |
| 2019 | 52,136 | 15,467 | 67,603 | 23% |
| 2020 | 37,177 | 16,974 | 54,151 | 31% |
| 2021 | 48,793 | 25,438 | 74,231 | 34% |
| 2022 | 55,399 | 34,405 | 89,803 | 38% |
| 2023 | 59,324 | 39,714 | 99,038 | 40% |
| 2024 | 62,688 | 45,292 | 1,07,980 | 42% |
| 2025 | 61,949 | 53,342 | 1,15,291 | 46% |
Source: Pitch Madison Advertising Report 2026, Table 1.2 (legacy definition). Shares as published.
Traditional media did not collapse. It stopped growing.
The usual story is that digital ate traditional media’s lunch. The numbers say something more precise. Traditional spend grew in seven of the nine years after 2016, fell hard once (by 29% in 2020) and recovered past its pre-pandemic level by 2022. It peaked at ₹62,688 crore in 2024.
What changed is where the new money went. From 2022 to 2024, digital took between 58% and 62% of each year’s growth, and in 2025 it took all of it: Pitch Madison reports that traditional media shrank by ₹739 crore while digital added ₹8,050 crore. FICCI-EY, measuring differently, reaches the same conclusion, crediting digital with 111% of the year’s ad growth because television fell.
So for most of the decade the old media were not losing budgets so much as losing the argument for the next budget.
In 2025, every rupee of growth in Indian advertising went to digital. Traditional media shrank by ₹739 crore.
Pitch Madison Advertising Report 2026; FICCI-EY Media and Entertainment Report 2026
Medium by medium, 2025
| Medium | 2025 (₹ crore) | Change on 2024 | What the report notes |
|---|---|---|---|
| Television | 32,855 | −5% | Ad volume down 10%; share of the market 28%, from 38% in 2016 |
| 20,866 | +3% | Space sold up about 1%; the rest is higher rates | |
| Outdoor (OOH) | 4,835 | +4% | Strongest growth among traditional media |
| Radio | 2,515 | +2% | Share flat at about 2% |
| Cinema | 877 | +3% | ₹523 crore in 2016; peaked at ₹1,045 crore in 2019 |
| Digital | 53,342 | +18% | Video, social, e-commerce, search and display |
Source: Pitch Madison Advertising Report 2026, Tables 4.1, 5.1, 6.1, 7.1, 8.1 and 3.3, and the television commentary in Section 4.
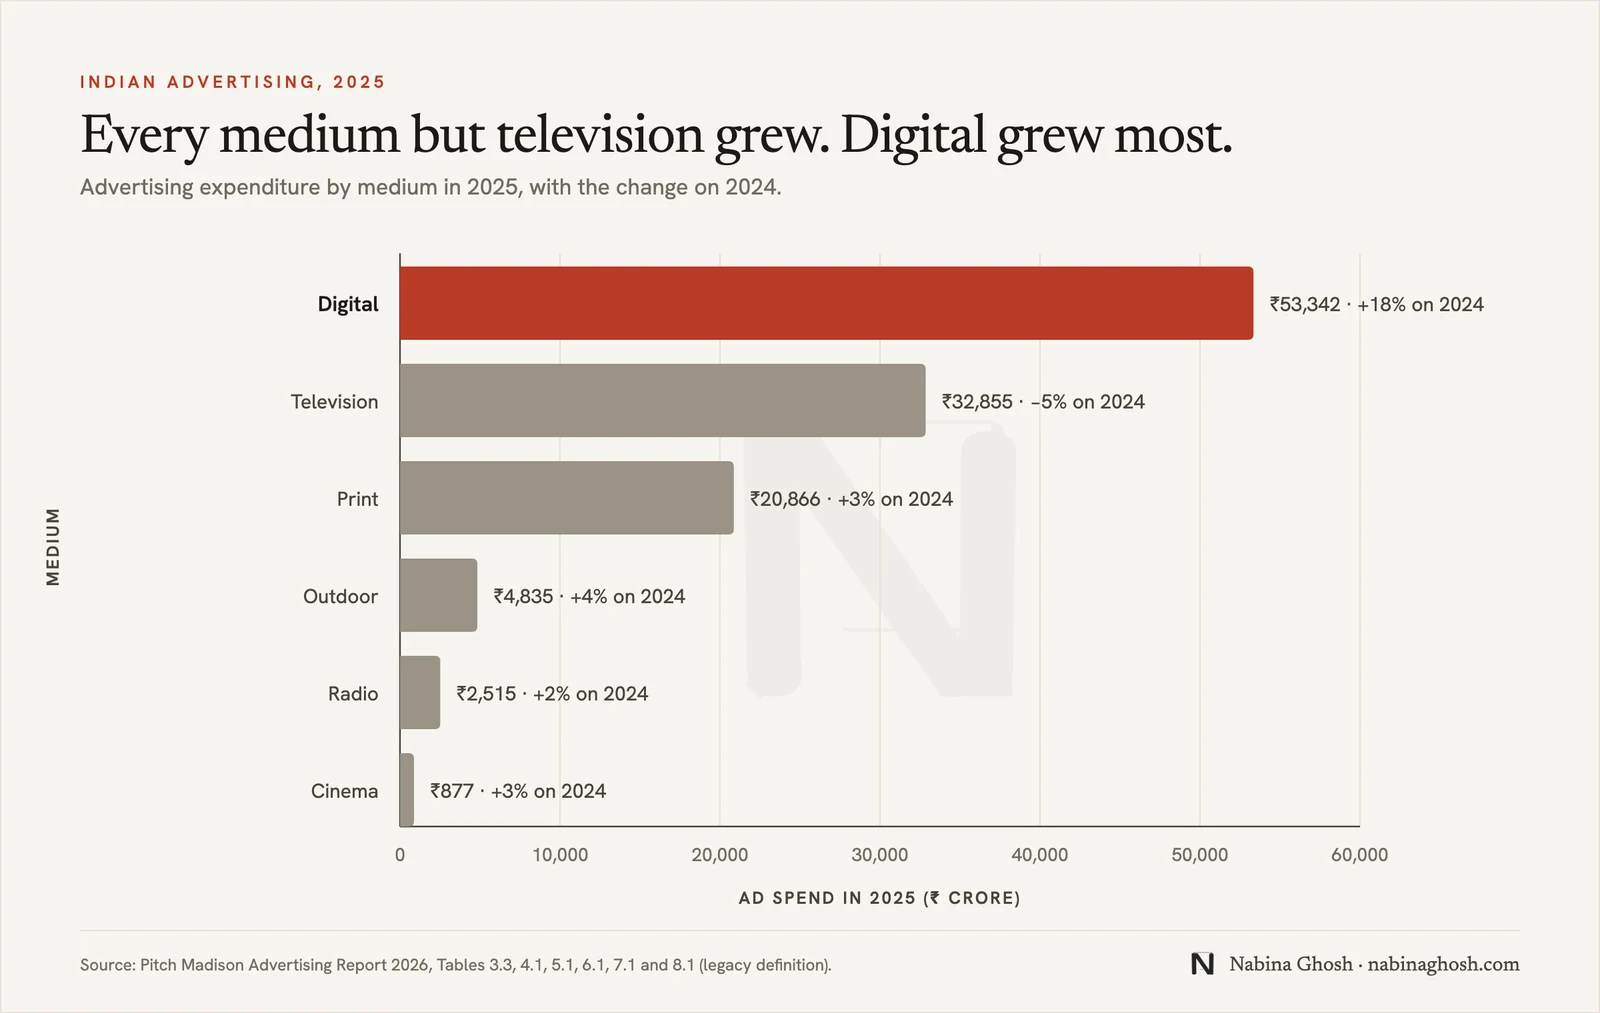
Television is still the largest single medium, but its share of the market has fallen by ten points in a decade. In 2025 the number of advertisers on TV fell by 6% and the seconds of advertising sold by 10%. Some of that money has not left the screen at all: it moved to Connected TV, which both reports count separately from broadcast television.
Six years on, the picture is starker. Set each medium’s 2025 spend against 2019, the last year before the pandemic, and print has only just got back to where it was: ₹20,045 crore then, ₹20,866 crore now, 4% higher in six years before any allowance for inflation. Cinema is still 16% below 2019. Outdoor (up 38%) and television (up 30%) recovered and grew. Digital grew 245%.
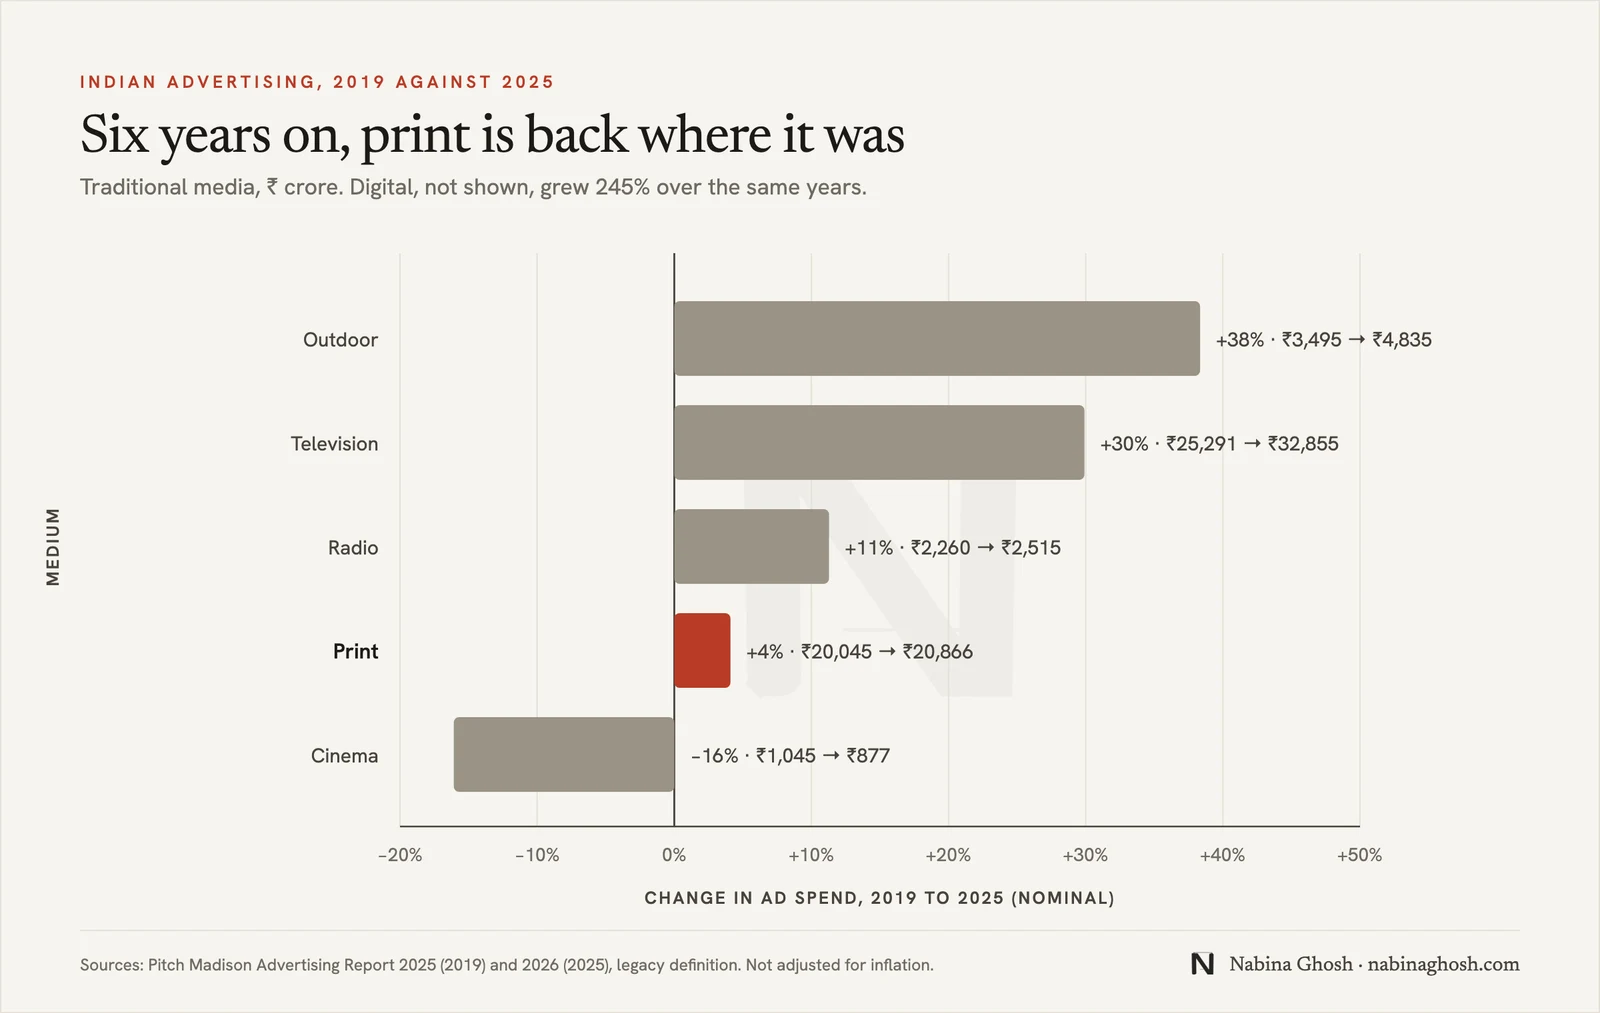
| Medium | 2019 (₹ crore) | 2025 (₹ crore) | Change |
|---|---|---|---|
| Television | 25,291 | 32,855 | +30% |
| 20,045 | 20,866 | +4% | |
| Outdoor | 3,495 | 4,835 | +38% |
| Radio | 2,260 | 2,515 | +11% |
| Cinema | 1,045 | 877 | −16% |
| Digital | 15,467 | 53,342 | +245% |
Sources: Pitch Madison Advertising Report 2025 (2019 figures, by medium) and 2026 (2025 figures). Same legacy definition in both; nominal rupees.
Print is the more interesting case. Its revenue rose, but the space sold barely moved, so the growth came from price. Pitch Madison describes advertisers buying fewer, more valuable insertions, such as front pages and jackets, for launches and detailed communication. By language, Hindi held 36% of print ad volume and did not grow; English rose 6% to a 30% share and was the only language that grew.
Where the digital money goes
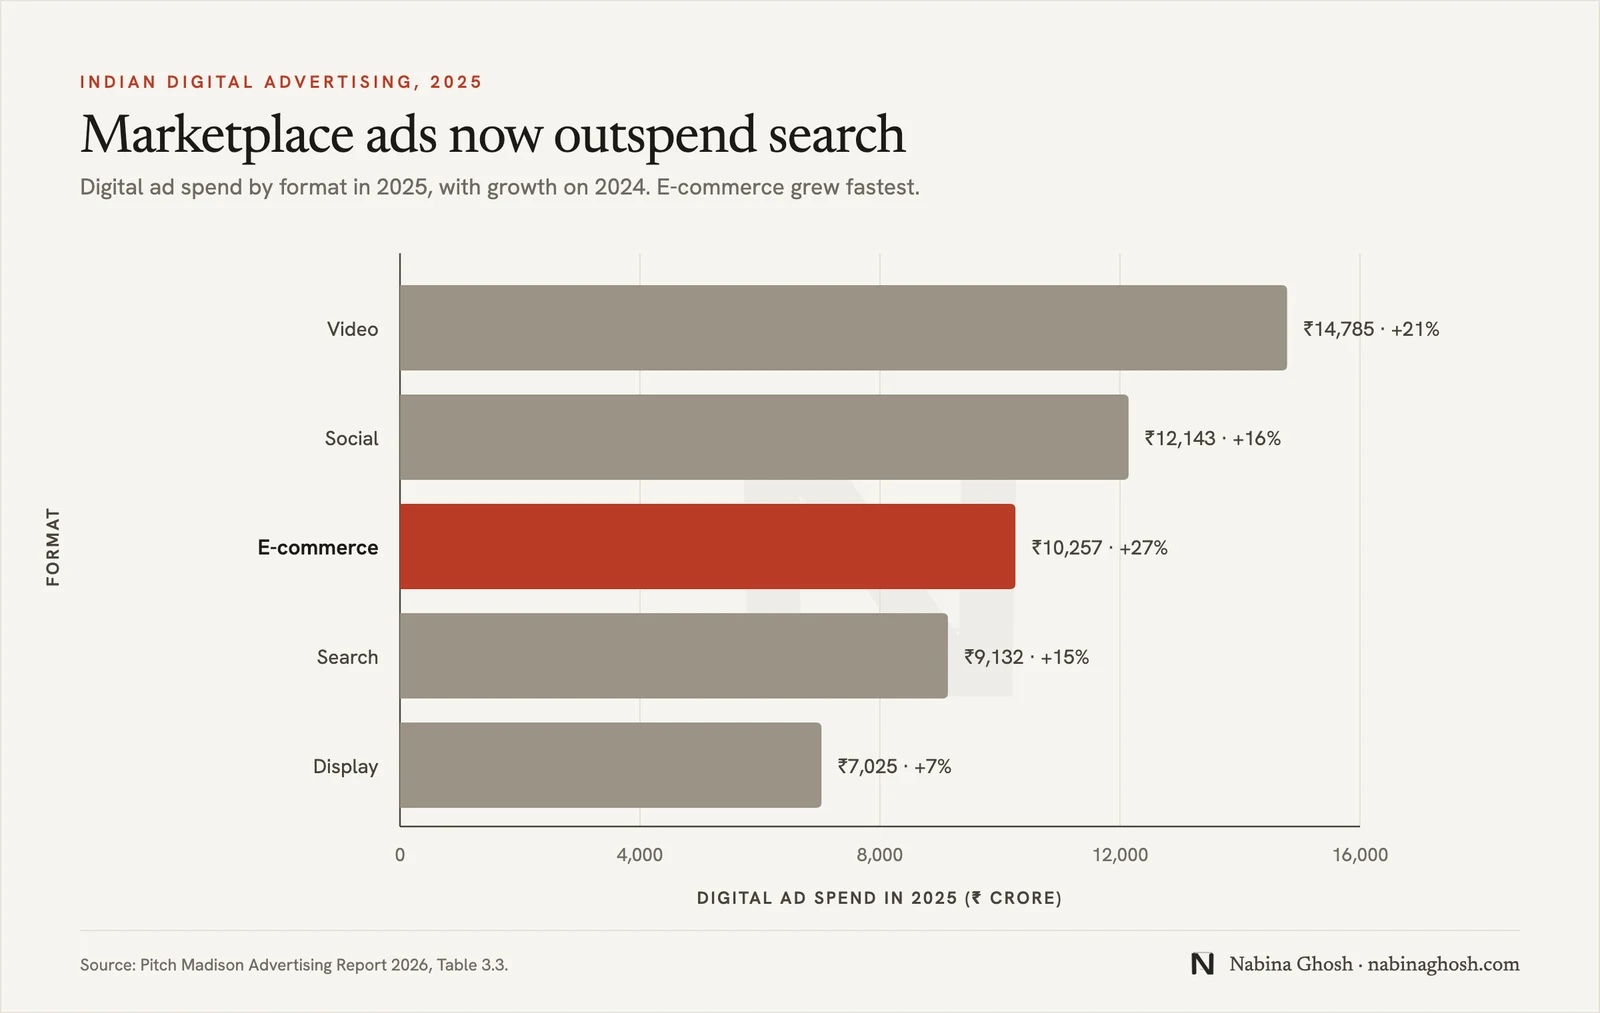
| Digital format | 2025 (₹ crore) | Share of digital | Growth on 2024 |
|---|---|---|---|
| Video | 14,785 | 28% | +21% |
| Social | 12,143 | 23% | +16% |
| E-commerce | 10,257 | 19% | +27% |
| Search | 9,132 | 17% | +15% |
| Display | 7,025 | 13% | +7% |
Source: Pitch Madison Advertising Report 2026, Table 3.3.
E-commerce advertising, the sponsored listings on marketplaces, grew fastest and is now larger than search. Pitch Madison estimates that formats bought for measurable outcomes (social, search and e-commerce, plus the performance end of video) make up about 70% of digital spend.
The expanded definition adds two streams of spending that the legacy definition leaves out. The first is quick-commerce advertising, on apps where a pack gets about half a second on screen. Pitch Madison puts it at ₹4,000 crore in 2025, up from ₹300 crore in 2023. The second is digital spending by small businesses, ₹35,814 crore. With both added, digital comes to ₹93,156 crore, or 60% of a ₹1,55,105 crore market.
Two reports, two numbers
If you are quoting the size of Indian advertising, it matters which report you use.
Indian advertising in 2025 was worth ₹1.15, ₹1.50 or ₹1.55 lakh crore, depending on whose definition you use.
Pitch Madison Advertising Report 2026 (legacy and expanded definitions); FICCI-EY Media and Entertainment Report 2026
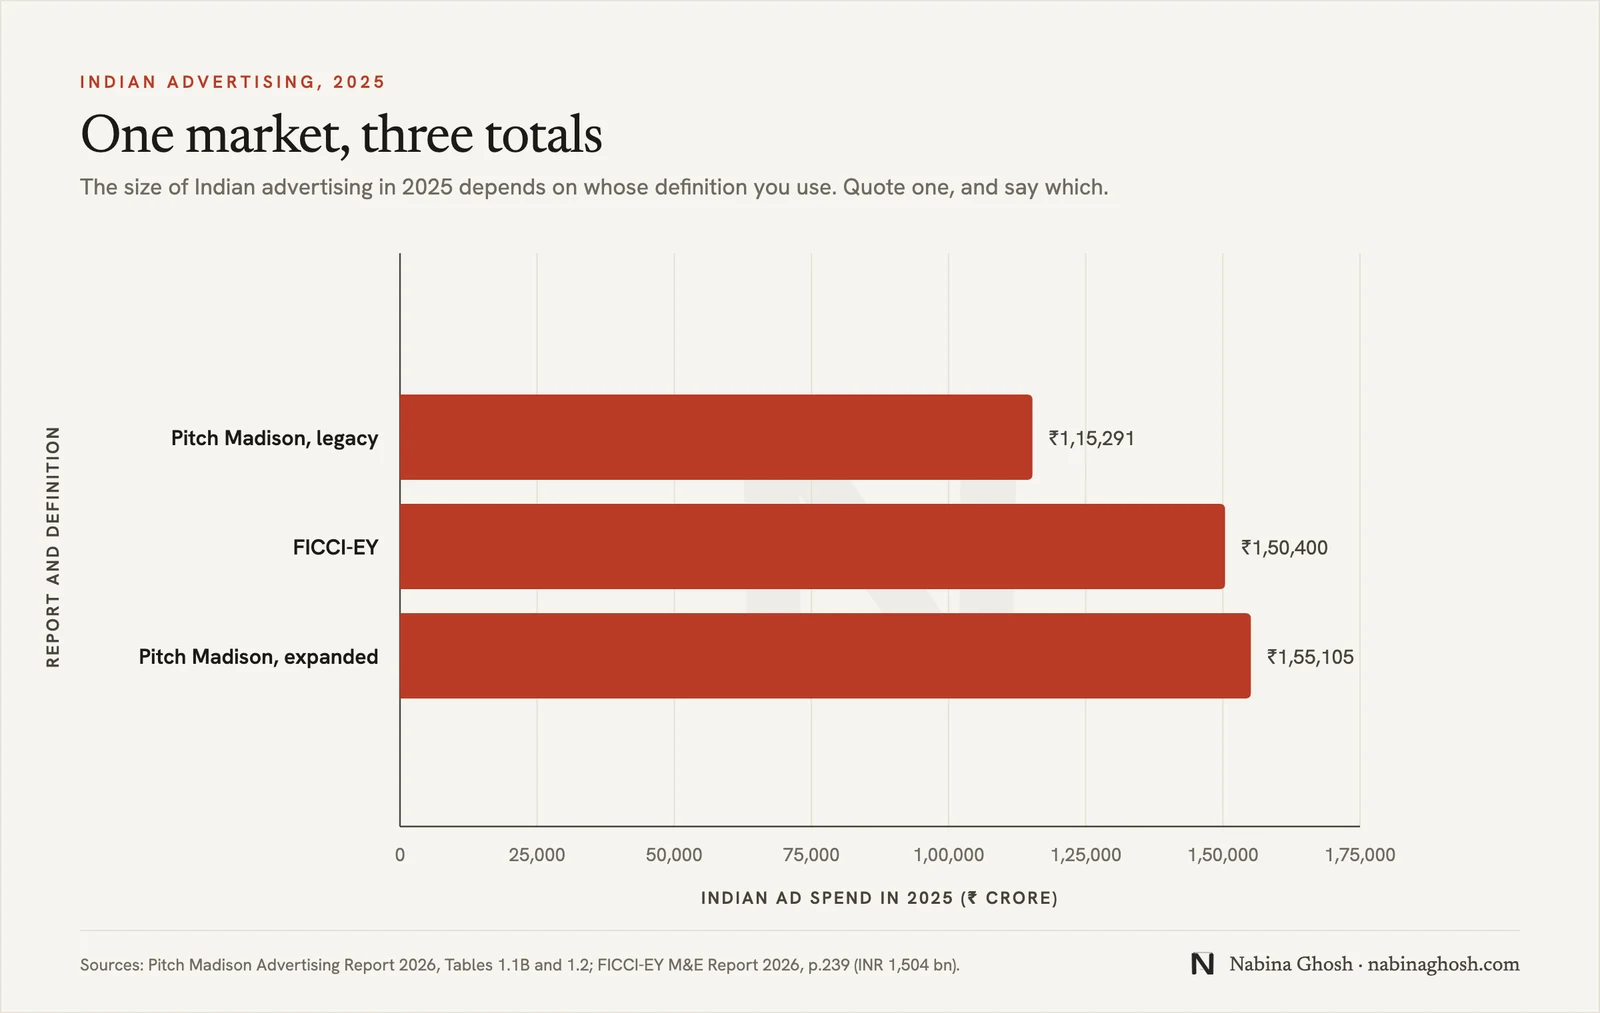
| 2025 | Pitch Madison (legacy) | Pitch Madison (expanded) | FICCI-EY |
|---|---|---|---|
| Total market | ₹1,15,291 crore | ₹1,55,105 crore | ₹1,50,400 crore |
| Digital share | 46% | 60% | 63% |
| Television | ₹32,855 crore | ₹32,855 crore | ₹26,300 crore |
| ₹20,866 crore | ₹20,866 crore | ₹17,900 crore |
Sources: Pitch Madison Advertising Report 2026, Tables 1.1B, 1.2, 4.1 and 5.1; FICCI-EY Media and Entertainment Report 2026, “Advertising in India” (INR billion converted to crore at 1 billion = 100 crore).
The differences come from definitions, not errors. FICCI-EY reports revenue gross of taxes, counts small and long-tail advertisers, and puts Connected TV under digital, which is one reason its television figure is lower and its digital share higher. Pitch Madison estimates spend net of standard trade discounts and keeps its older definition running alongside the new one so that years can be compared. Both agree on every direction that matters: digital up sharply, television down, print flat to slightly up, outdoor growing.
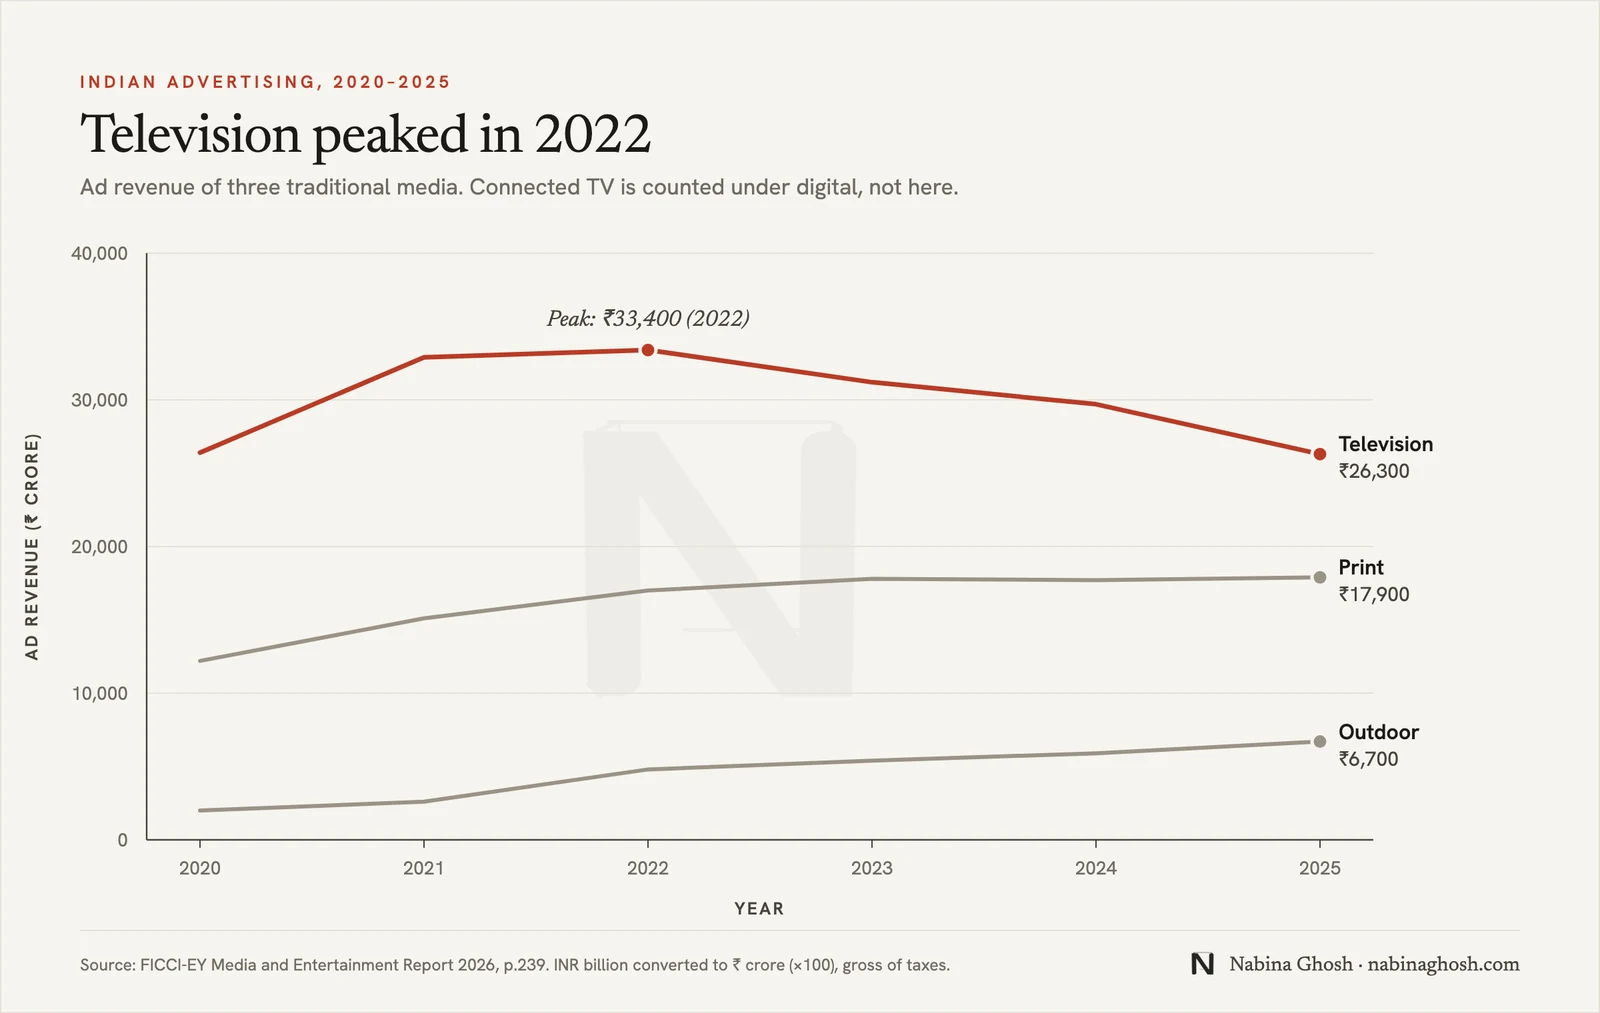
FICCI-EY’s series also shows television’s peak more clearly: ₹334 billion in 2022, against ₹263 billion in 2025, a fall of about a fifth in three years. Over the same years print held roughly level and outdoor kept growing.
India against the world
India remains unusually traditional by global standards. On Pitch Madison’s legacy definition, traditional media took 54% of Indian ad spend in 2025. The global figure the report cites from WARC is 21%. Traditional media fell 1% in India in 2025, against 4% globally. Whether India follows the global curve or keeps a larger traditional share for longer is the open question of the next decade.
What this means for the work
Most of the new money is buying short words. Social posts, search ads and marketplace listings now take more than half of digital spend, and digital takes almost half the market. That is copy written in fragments, tested quickly and judged on clicks. It is still copy, and the brands that write it well, in a consistent voice, stand out in formats where most do not try.
Print is being bought for the moments that need explaining. If advertisers are buying fewer, more prominent print insertions for launches and detailed messages, each one carries more weight than a frequency schedule did. Long copy has a smaller home than it did in 2016, but it has not lost it, and in English it is growing.
Fewer TV seconds means each one has to work harder. With television volumes down 10% in a single year and money moving to Connected TV and online video, a script has to earn attention in more places, at more lengths, often without the guarantee of a full thirty seconds. A TVC script now has to be written for the cut-downs as well as the full spot.
Method and sources
- Pitch Madison Advertising Report 2026 (Pitch and Madison World, February 2026). Table 1.2 (PDF p.9) for the ten-year series on the legacy definition; Table 1.1B (p.9) for the expanded definition; Table 1.6 (p.15) for the global comparison; Table 3.3 (p.36) for digital formats; Table 4.1 and commentary (p.40) for television; Tables 5.1 and 5.3 (pp.47-48) for print; Tables 6.1, 7.1 and 8.1 (pp.53, 56, 59) for radio, outdoor and cinema. Its methodology (Section 14) describes the figures as estimates, not an audited ledger.
- Pitch Madison Advertising Report 2025 (February 2025), for each medium’s 2019 spend: the yearly-spend charts on PDF pp.13 (digital), 17 (television), 23 (print), 29 (outdoor), 33 (radio) and 38 (cinema). For every year from 2019 to 2024 the five traditional media in that edition sum to the traditional total in the 2026 report’s ten-year table.
- FICCI-EY, Stories, scale and impact: Unlocking India’s media and entertainment economy (March 2026). “Advertising in India” table (PDF p.239), INR billion, gross of taxes, including SME and long-tail advertisers.
- Calculations are ours. Growth multiples and annual rates are compound, from 2016 to 2025 (nine years), on the published figures. All rupee figures are nominal, not adjusted for inflation.
- Two small discrepancies in the sources. Pitch Madison’s 2018 and 2022 totals differ from the sum of their parts by ₹1 crore, which is rounding. FICCI-EY’s 2024 figures by medium add up to INR 1,330 billion against a stated total of 1,326 billion; we quote its stated totals.
If you work with these numbers and spot an error, tell me and I will correct it. If you need advertising copywriting for any of the media above, the same page will reach me.
Using these charts
The charts and tables on this page are free to republish, in print or online, with credit to Nabina Ghosh and a link to this page. Each chart already carries its sources. If you need a chart at a different size, or the underlying numbers as a spreadsheet, ask.
Frequently asked questions
How big was the Indian advertising market in 2025?
It depends on the definition. The Pitch Madison Advertising Report 2026 puts it at ₹1,15,291 crore on its long-running definition, or ₹1,55,105 crore once quick commerce and small-business digital spends are added. The FICCI-EY 2026 report, which also counts small and long-tail advertisers, puts it at about ₹1.5 lakh crore (INR 1,504 billion).
What share of Indian advertising is digital?
Between 46% and 63% in 2025, depending on whose definition you use. Pitch Madison's legacy definition gives 46%; its expanded definition gives 60%; FICCI-EY gives 63%. In 2016, on Pitch Madison's legacy definition, it was 15%.
Is print advertising still growing in India?
Slightly. Pitch Madison has print at ₹20,866 crore in 2025, up 3%, but almost all of that came from higher rates: the space sold was nearly flat. English was the only print language whose ad volume grew. Print's share of the market keeps falling because everything else grows faster.
Why do Pitch Madison and FICCI-EY give different numbers?
They measure different things. Pitch Madison estimates spend net of standard trade discounts, and keeps its legacy definition running alongside an expanded one. FICCI-EY reports revenue gross of taxes, includes small and long-tail advertisers, and counts Connected TV under digital rather than television. Both agree on the direction; quote one, and say which.
Working on something like this?
Tell me about the campaign, the medium and the deadline. I'll tell you how I would approach it and what it would take.
Advertising Copywriting: how the service works →